August 9, 2011
The data for this graph comes from Lake Superior Meteorological Buoy at the University of Minnesota-Duluth. The data was gathered at 5:00 AM on July 28, 2011. The graph was produced with Geogebra.
"If others would but reflect on mathematical truths as deeply and as continuously as I have, they would make my discoveries." - Carl Friedrich Gauss
August 9, 2011
The data for this graph comes from Lake Superior Meteorological Buoy at the University of Minnesota-Duluth. The data was gathered at 5:00 AM on July 28, 2011. The graph was produced with Geogebra.
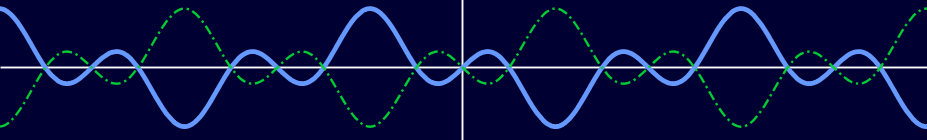
The data for this graph comes from from the Lake Superior Meteorological Buoy at the University of Minnesota-Duluth. The data was gathered at 5:00 AM on July 28, 2011. The graph was produced in Geogebra.
The data for this graph comes from from the Lake Superior Meteorological Buoy at the University of Minnesota-Duluth. The data was gathered at 5:00 AM on July 28, 2011. The graph was produced in Geogebra.
The data for this graph comes from from the Lake Superior Meteorological Buoy at the University of Minnesota-Duluth. The data was gathered at 5:00 AM on July 28, 2011. The graph was produced in Geogebra.
The data for this graph comes from from the Lake Superior Meteorological Buoy at the University of Minnesota-Duluth. The data was gathered at 5:00 AM on July 28, 2011. The graph was produced in Geogebra.
July 23, 2011
In order to begin learning to use JSXGraph (which also requires that I learn javascript) I created an application in which a line is randomly generated and the user enters what she thinks the equation is. Her equation is then graphed for comparison with the Read more…
In order to begin learning to use JSXGraph (which also requires that I learn javascript) I created an application in which a line is randomly generated and the user enters what she thinks the equation is. Her equation is then graphed for comparison with the Read more…